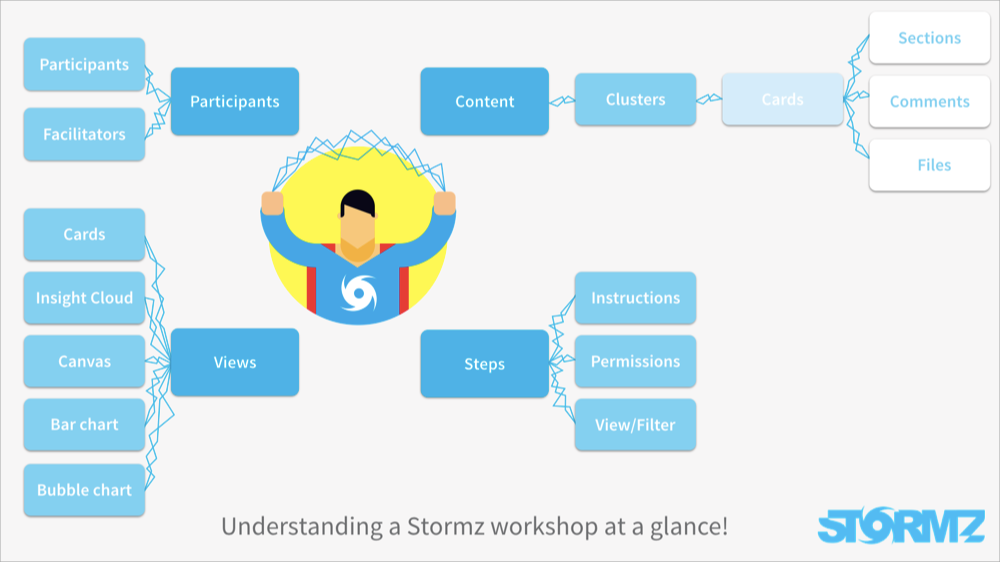
An overview of a Stormz workshop
A Stormz workshop is made of 4 major components:
- The users: those who take part in the workshop.
- The steps: the collaborative process that will be used during the workshop.
- The content: all the contributions of the participants.
- The views: the way the contributions are displayed to the participants.
The users
A Stormz workshops has three types of users
- The facilitator creates and facilitates the workshop. He has some special “powers” over the attendees.
- The observer can always see the different contributions. Even when participants cannot.
- The participants participate in the workshop by contributing content.
The steps
Steps are one of the most important concepts in Stormz as they enable you to design sophisticated collaborative processes. With the right sequence of steps, you can mimic many different methodologies or techniques.
Each step is defined by:
- Written or video instructions that explain what the participants have to do at this step
- Permissions that define what features are available to the participants at this step
- Views that define what the participants can and cannot see at this step
The content
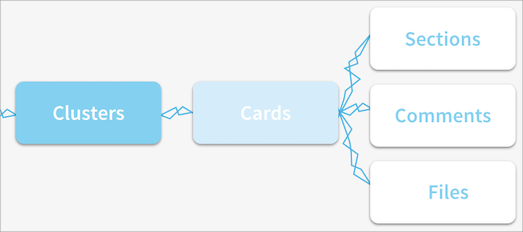
Content is contributed by the users throughout the workshop. In a Stormz workshop the content is structured with:
- Clusters that regroup several cards by category or theme or main idea.
- Cards that are the main component in Stormz. Cards can represent quite anything: an idea, a solution, a problem, a cause, a persona...
- Files that can be attached to a card. If the file is an image it can be displayed within the card.
- One or several lists. lists are lists of items (for example Pros, Cons, Actions...) that are located inside a card.
- Comments are used to launch a discussion around the content of a specific card.
The views
Views are used to display the same content but in different ways:
- Card view. The default view that shows the clusters and their cards.
- The Canvas view shows the cards within a canvas. Simple ones such as grids, columns or more complex ones such as the business model canvas.
- The Bar chart is used to display the result of a voting session.
- The Bubble chart is used to display the result of an evaluation step.
- The Insight cloud is a view that display the content as a smart word cloud.